


- Agile planning
- Competitive (dis)Advantages
- Doctor Advocacy and Perception
5K
partner doctors
with deep
relationships

5K
partner doctors
with deep
relationships
250K
parameters &
preferences per
doctor

250K
parameters &
preferences per
doctor
80%+
doctors with
longitudinal
data/ trends

80%+
doctors with
longitudinal
data/ trends
95%+
accurate predictor
of Rx share over
3-6 months

95%+
accurate predictor
of Rx share over
3-6 months
10%+
Improvement in
doctor
advocacy via
targeted GTM

10%+
Improvement in
doctor
advocacy via
targeted GTM
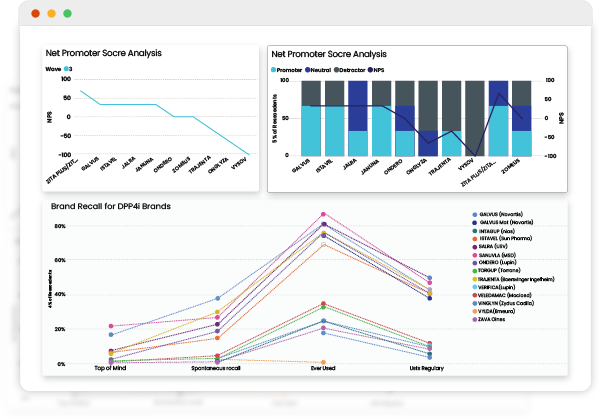
NPS based Customer
Advocacy
Most reliable leading indicator of doctor
stickiness and Rx share
Longitudinal Competitor benchmarking
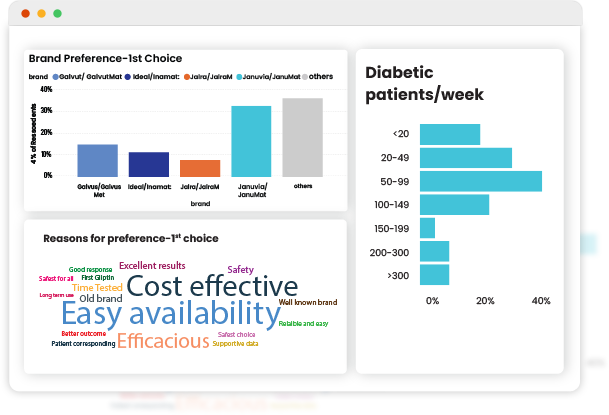
Brand Positioning
and Messaging
Next Order Insight on Rx trends
Brand messaging to strengthen doctor
connect or to improve positioning
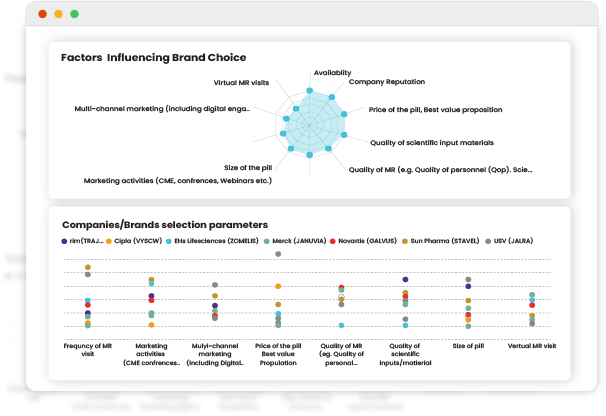
Multi-factor X-Ray
Deep understanding of relative comparison with competitors / peers across 8-10 factors
(Re)defining Marketing Activities to improvise
positioning across most important factors

- Learn from one of the most comprehensive oncology data banks across emerging markets
- Review rapidly evolving therapy trends with longitudinal patient journeys over 10+ years
- Identify macro & micro trends with detailed assessment of clinical outcomes
>100K
unique patient lives
with comprehensive
de-identified
datasets
>100K
unique patient lives
with comprehensive
de-identified
datasets
200+
parameters and
endpoints per
patient, including
genetic markers
200+
parameters and
endpoints per
patient, including
genetic markers
7
cancer types
included
7
cancer types
included
10+
years of longitudinal
data across
patients
10+
years of longitudinal
data across
patients
400+
oncologists covered
across partner
network
400+
oncologists covered
across partner
network

Tumor Profiling
Profiling and burden of cancer sub-types
Treatment choice across patient cohorts and cancer sub-types
Patient Profiling
Patient demographics and family history
Patient lifestyle and behaviours
Clinical and health conditions

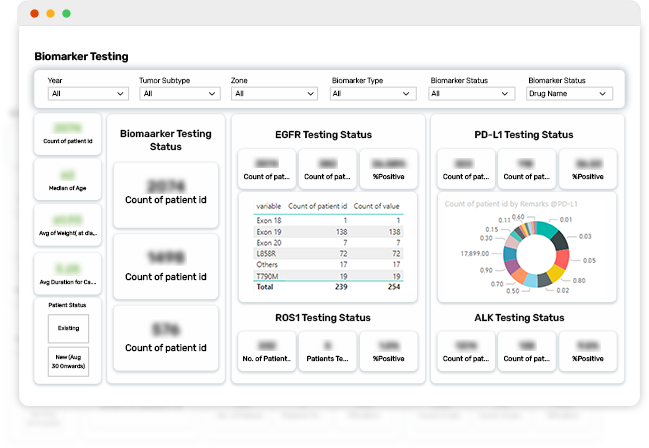
Informed Cancer Care
Diagnostic methods across patient cohorts
Outcomes by diagnostic methods
Diagnostic methods to define treatment regimes and drugs


- Automated real-time monitoring of your hospital’s performance
- 200+ KPIs to track operational and clinical efficiency
- Improve your readiness for Audits and Accreditations
- Reduce operational costs and prevent revenue leakage
15-20%
reduction in
surgical
consumables
15-20%
reduction in
surgical
consumables
10%+
overall purchase
cost reduction
identified
10%+
overall purchase
cost reduction
identified
70%+
revenue upside
identified across
leakage points
70%+
revenue upside
identified across
leakage points
25%+
improvement in
working capital
25%+
improvement in
working capital
~10+
lower claim
rejections /
disallowances
~10+
lower claim
rejections /
disallowances

Measure and Monitor
Real time dashboards integrated across
360-degree data systems
End-to-end view across Strategic,
Financial, Clinical, Operational KPIs
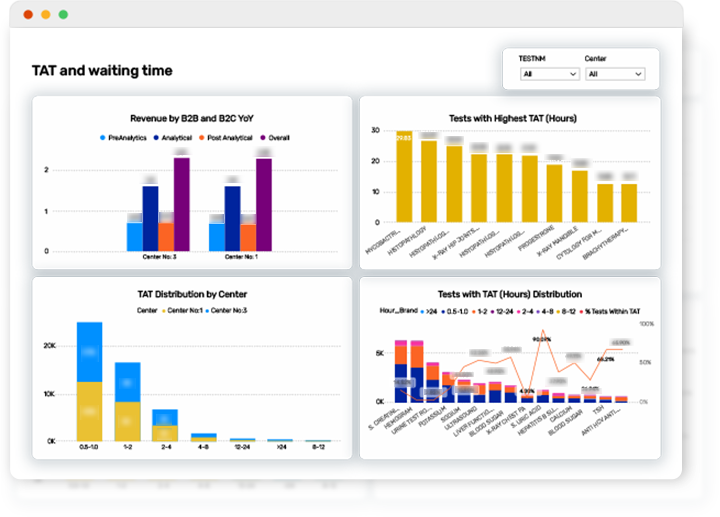
Service Delivery and
Operations X-Ray
Key efficiency levers including, but not limited to, OP waittime, IP discharge time, lab reporting TAT, Triage time, OT utilization
Trigger enabled alerts on extreme operational shortfalls to ensure real-time interventions
Patient satisfaction correlations with operational efficiencies
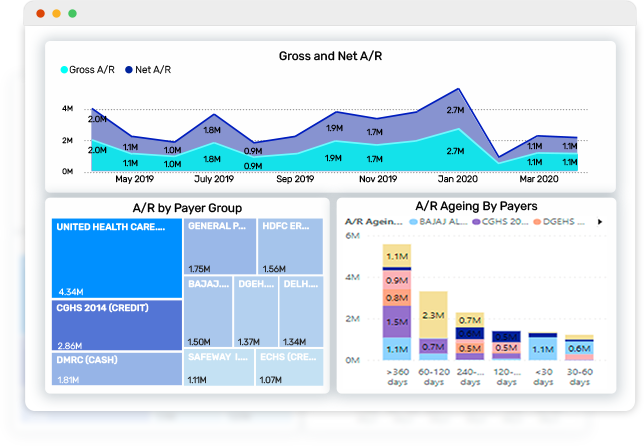
Revenue Cycle
Management
Detailed actionable intelligence on revenue cycles and account receivables
Payor-wise and Ageing-wise trends
Trigger enabled alerts for continued rejections and above-threshold outstanding
